The Changelog
What's new around here?
Succinct and informative updates about Flux.
August 19, 2026
Horizontal charts
Version ^2.18.0
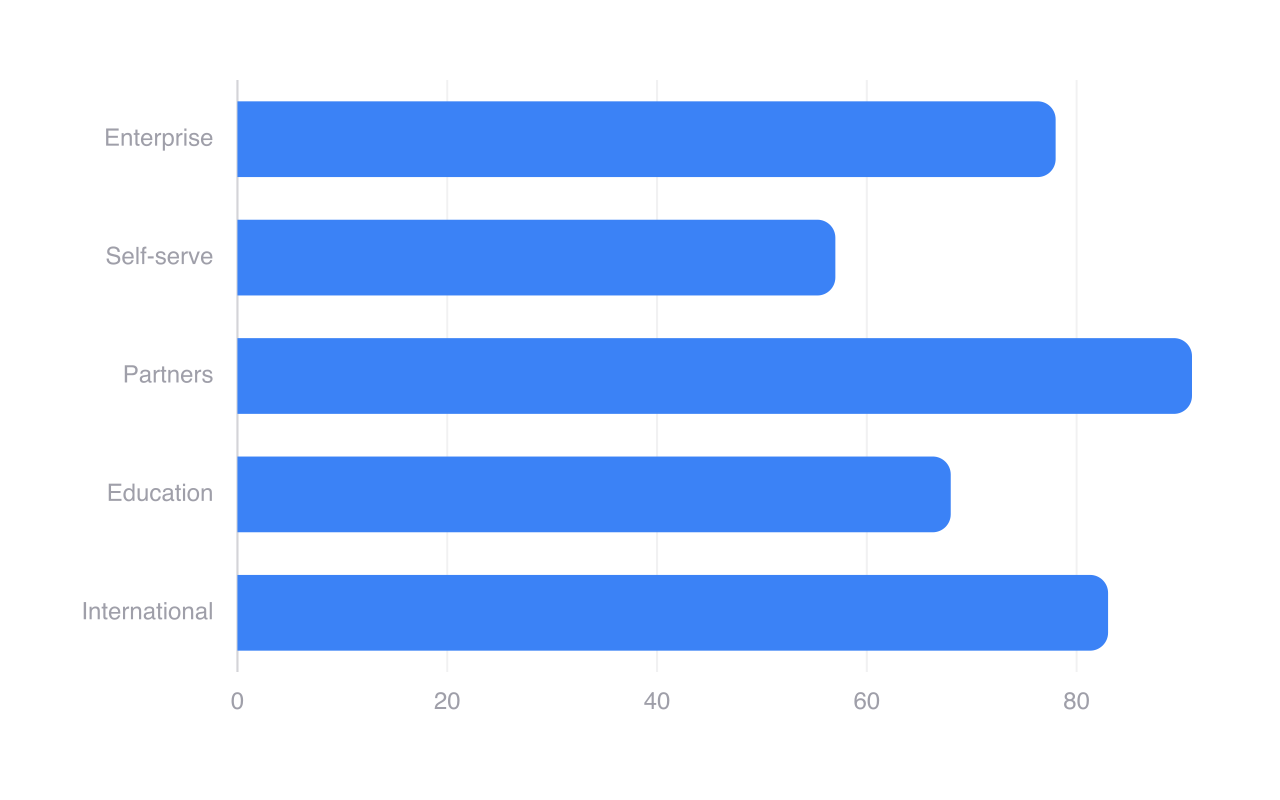
Flux charts now support horizontal layouts. Add the horizontal prop and Flux will place the chart's index on the Y axis and its values on the X axis.
Bars, groups, stacks, lines, areas, points, cursors, and tooltips all work the same way—just turned on their side.
One prop, same chart
Copy to clipboard
<flux:chart horizontal wire:model="data" class="aspect-[2/1]"> <flux:chart.svg> <flux:chart.bar field="accounts" class="text-blue-500" radius="4 0" /> <flux:chart.axis axis="y" field="team"> <flux:chart.axis.tick /> <flux:chart.axis.line /> </flux:chart.axis> <flux:chart.axis axis="x"> <flux:chart.axis.grid /> <flux:chart.axis.tick /> </flux:chart.axis> </flux:chart.svg></flux:chart>The category or time field moves to the Y axis, while the numeric scale moves to the X axis. Everything else stays composable, so existing bar, line, and area charts can use the same components and configuration.
Mix, group, and stack
Horizontal orientation works across the full chart system. You can group bars for side-by-side comparisons, stack them to show totals, mix positive and negative values around a zero line, or transpose a line and area chart without learning a separate API.
Build them visually
The chart builder now includes a Horizontal preset and an orientation control. Pick a layout, configure logical index and value axes, then copy the generated Blade markup into your project.