The Changelog
What's new around here?
Succinct and informative updates about Flux.
February 9, 2026
Bar charts + chart builder
Version ^2.12.0
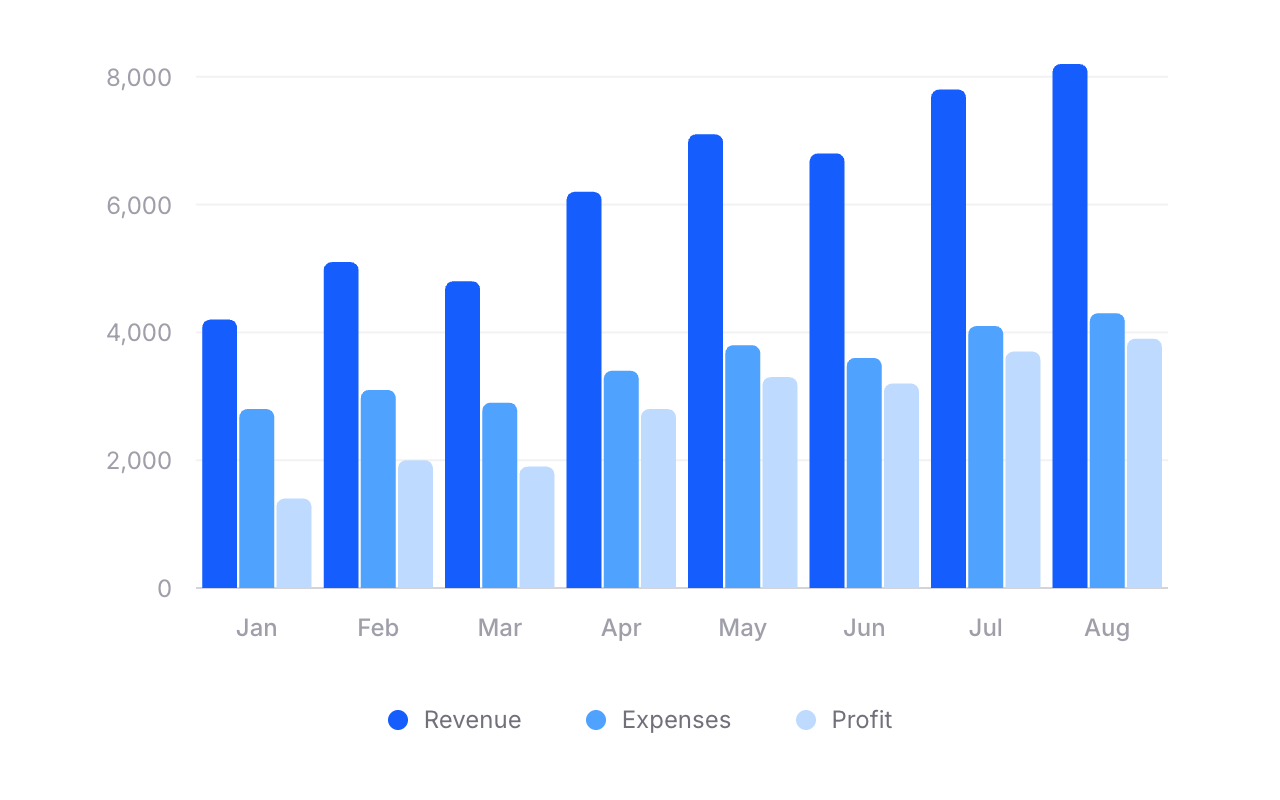
Flux charts just got a whole lot more powerful. As of v2.12.0, our chart component now supports bar charts — single bars, grouped bars, stacked bars, and even mixed line-and-bar charts.
We also built a dedicated chart builder → so you can visually design your chart and copy the code straight into your Blade templates.
Let's take a look.
Bars. Groups. Stacks.
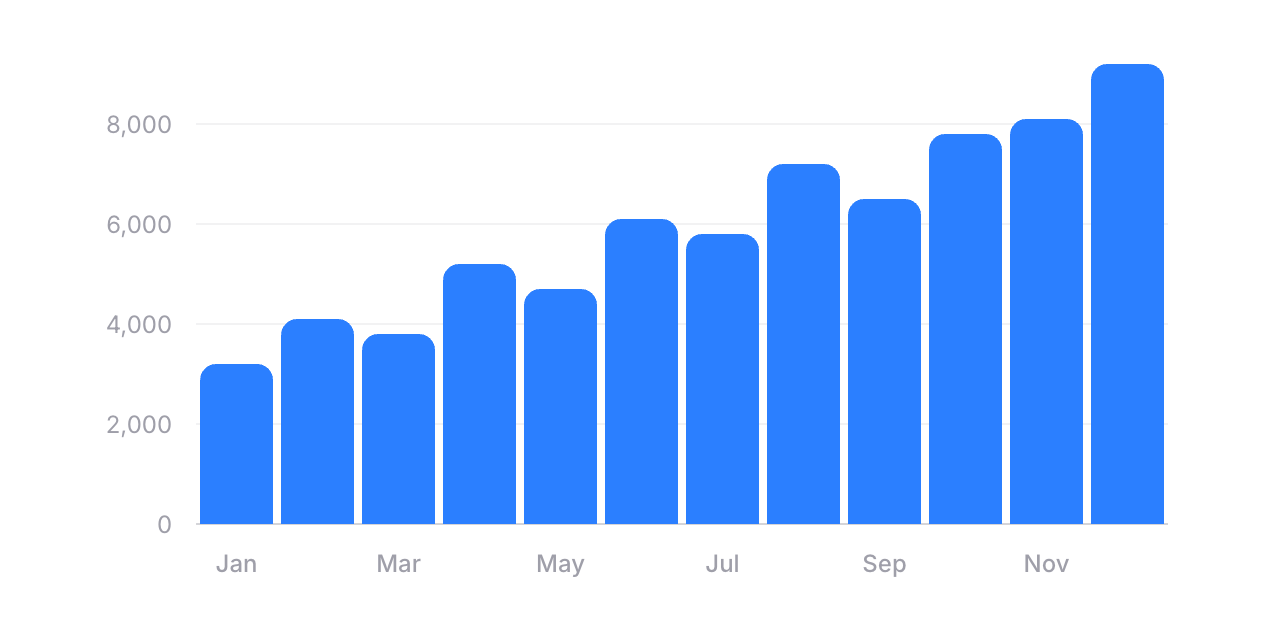
Adding a bar chart is as simple as swapping flux:chart.line for flux:chart.bar:
Copy to clipboard
<flux:chart wire:model="data" class="aspect-[3/1]"> <flux:chart.svg> <flux:chart.bar field="revenue" class="text-blue-500" /> <flux:chart.axis axis="x" field="date"> <flux:chart.axis.tick /> <flux:chart.axis.line /> </flux:chart.axis> <flux:chart.axis axis="y"> <flux:chart.axis.grid /> <flux:chart.axis.tick /> </flux:chart.axis> </flux:chart.svg></flux:chart>You can customize radius for rounded corners, width to control bar thickness, and min-height so small values still remain visible. Everything you'd expect.
Grouped bars
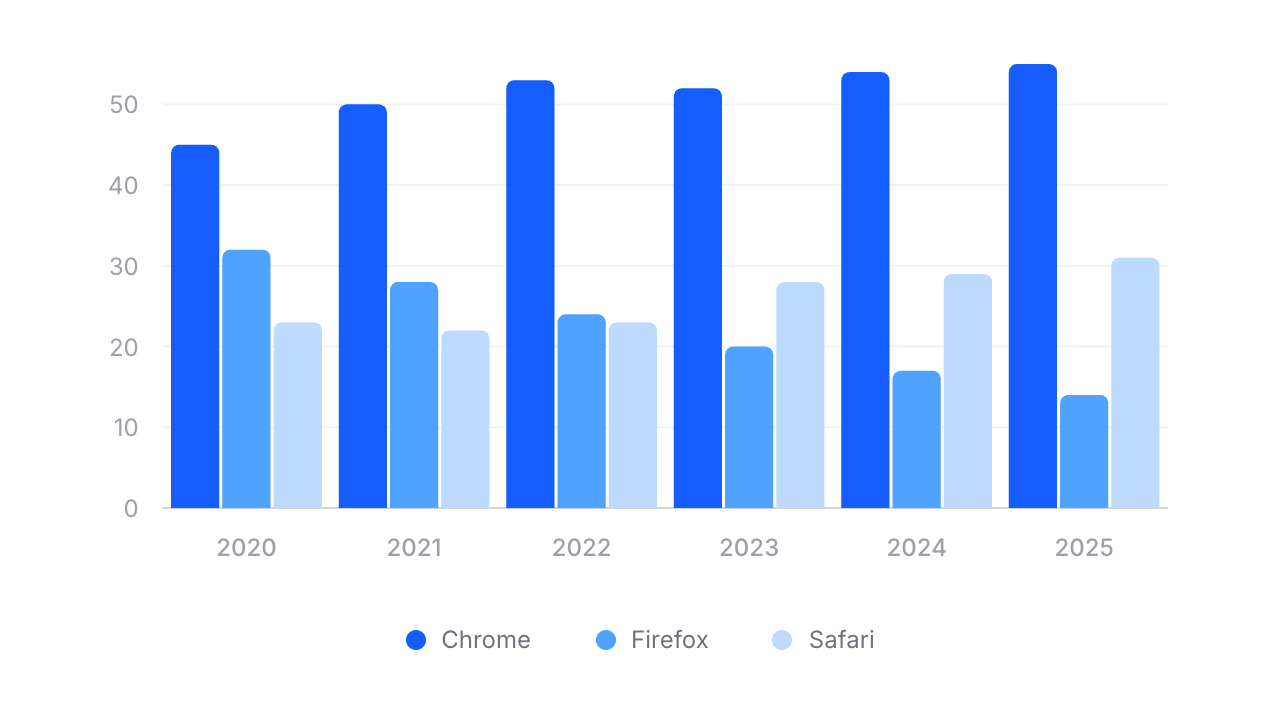
Need to compare multiple data series side by side? Wrap your bars in a flux:chart.group:
Copy to clipboard
<flux:chart wire:model="data"> <flux:chart.viewport class="aspect-[3/1]"> <flux:chart.svg> <flux:chart.group> <flux:chart.bar field="chrome" class="text-blue-600" /> <flux:chart.bar field="firefox" class="text-blue-500" /> <flux:chart.bar field="safari" class="text-blue-300" /> </flux:chart.group> <!-- ... axes ... --> </flux:chart.svg> </flux:chart.viewport> <div class="flex justify-center gap-4 pt-4"> <flux:chart.legend label="Chrome"> <flux:chart.legend.indicator class="bg-blue-600" /> </flux:chart.legend> <!-- ... --> </div></flux:chart>Stacked bars
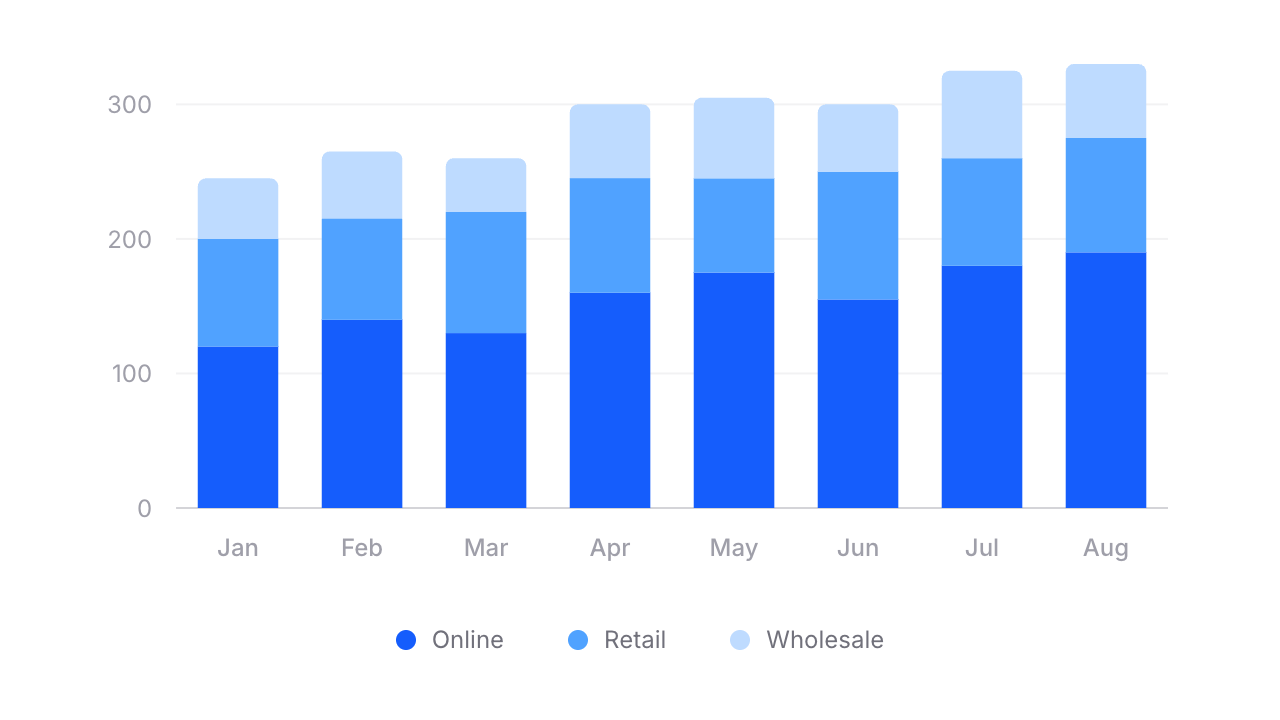
For stacked bars, swap flux:chart.group for flux:chart.stack:
Copy to clipboard
<flux:chart.stack width="65%"> <flux:chart.bar field="online" class="text-blue-600" /> <flux:chart.bar field="retail" class="text-blue-400" /> <flux:chart.bar field="wholesale" class="text-blue-300" radius="4 0" /></flux:chart.stack>Notice radius="4 0" on the last bar — that rounds only the top corners of the stack, giving it a clean, finished look.
Mix and match
Because Flux charts are fully composable, you can combine lines and bars in the same chart. Want a bar chart with a trend line overlaid? Just include both:
Copy to clipboard
<flux:chart wire:model="data"> <flux:chart.svg> <flux:chart.bar field="revenue" class="text-blue-300" /> <flux:chart.line field="trend" class="text-blue-600" /> <!-- ... --> </flux:chart.svg></flux:chart>No special config. No mode switching. Just composable components.
Build charts visually
Rather than fiddling with JSON configuration objects like most charting libraries, we built a chart builder where you can visually design your chart from start to finish. Pick a preset, configure your series, tweak axes and tooltips, then hit "Get code" and paste clean Blade markup straight into your project.